Activity 3 uses the ALA data and doesn’t involve going out and collecting any data for yourself. If you would like to use data from your area, see User Guide 1 – Finding the species recorded in our area.
The following is a table from the ALA containing the mammal species numbers recorded in the area surrounding the suburb of Theodore in the ACT.
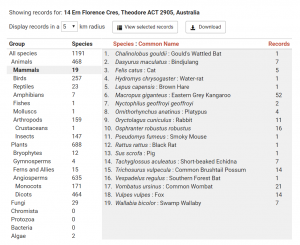
- Using this table, write the Common Names of the 9 mammals with the most records, starting with the most.
- Draw a column graph to represent these 9 mammals.
- Generate a pie chart showing these 9 mammals.
- Which graph do you think represents the information best? Why?
- What fraction of the mammals recorded in this table are Eastern Grey Kangaroos?
- What fraction of the mammals recorded in this table are introduced species?
- You are visiting this area. Using your column graph data, what is the percentage probability that the first mammal you see will be a rabbit?
- Do you think it is correct to say that the most common mammal species in Theodore is the Eastern Grey Kangaroo?
Links to the Australian Curriculum
Depending on the Year Level and the parts of the activity you choose, the following content could be covered by Activity 3.
Year 2
Collect, check and classify data (ACMSP049)
Create displays of data using lists, table and picture graphs and interpret them (ACMSP050)
Year 3
Collect data, organise into categories and create displays using lists, tables, picture graphs and simple column graphs, with and without the use of digital technologies(ACMSP069)
Interpret and compare data displays (ACMSP070)
Year 4
Construct suitable data displays, with and without the use of digital technologies, from given or collected data. Include tables, column graphs and picture graphs where one picture can represent many data values (ACMSP096)
Evaluate the effectiveness of different displays in illustrating data features including variability (ACMSP097)
Describe possible everyday events and order their chances of occurring (ACMSP092)
Year 5
Construct displays, including column graphs, dot plots and tables, appropriate for data type, with and without the use of digital technologies (ACMSP119)
Describe and interpret different data sets in context (ACMSP120)
List outcomes of chance experiments involving equally likely outcomes and represent probabilities of those outcomes using fractions (ACMSP116)
Recognise that probabilities range from 0 to 1(ACMSP117)
Year 6
Interpret and compare a range of data displays, including side-by-side column graphs for two categorical variables (ACMSP147)
Describe probabilities using fractions, decimals and percentages (ACMSP144)
Year 7
Construct and compare a range of data displays including stem-and-leaf plots and dot plots (ACMSP170)
Assign probabilities to the outcomes of events and determine probabilities for events (ACMSP168)