Go out into the school yard and look for birds.
- Keep a count of the bird name, the number of them and where you saw them in a table.
- Using the ALA Explore your area (See User Guide 1 – Finding the species recorded in your area) as a guide, draw a map of your schoolyard. Develop a key for your map to show which birds were seen where. Use grid references.
Image 1 – Sample schoolyard map from the ALA
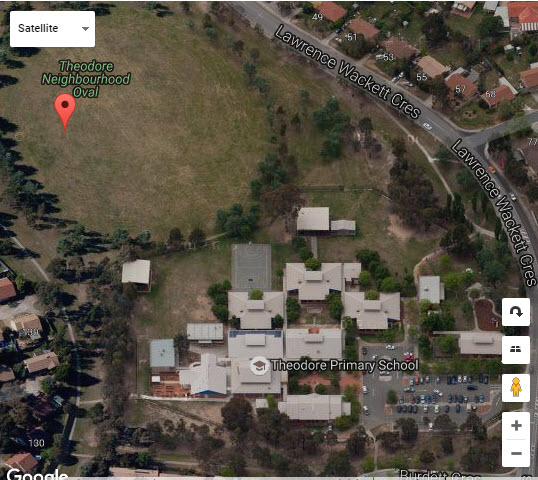
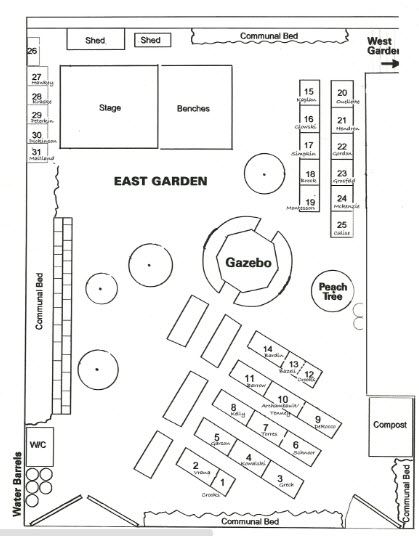
Image 2 – Your schoolyard map drawing may look something like this
Links to the Australian Curriculum
Depending on the Year Level and the parts of the activity you choose, the following content could be covered by Activity 2.
Year 1
Give and follow directions to familiar locations (ACMMG023)
Year 2
Interpret simple maps of familiar locations and identify the relative positions of key features
Create displays of data using lists, table and picture graphs and interpret them (ACMSP050)
Year 3
Create and interpret simple grid maps to show position and pathways (ACMMG065)
Collect data, organise into categories and create displays using lists, tables, picture graphs and simple column graphs, with and without the use of digital technologies(ACMSP069)
Year 4
Construct suitable data displays, with and without the use of digital technologies, from given or collected data. Include tables, column graphs and picture graphs where one picture can represent many data values (ACMSP096)
Year 5
Use a grid reference system to describe locations. Describe routes using landmarks and directional language (ACMMG113)
Construct displays, including column graphs, dot plots and tables, appropriate for data type, with and without the use of digital technologies (ACMSP119)