Discuss with students which birds they have seen in the school yard in the past, then go out into the school yard and look for birds.
• Keep a count of the bird name and the number of them in a table.
• Use your data to prepare a picture graph showing the bird numbers.
• Use your data to prepare a column graph showing the bird numbers.
• Use your data to prepare a pie chart showing the bird numbers.
• Which type of graph do you think represents the data best? Why?
• Write the bird names from your table in order from most common to least common.
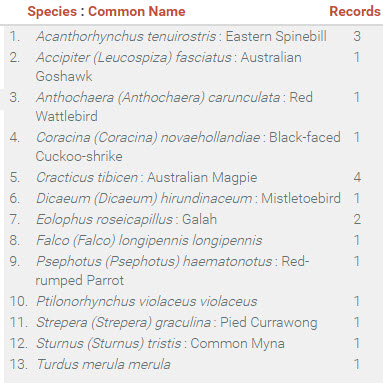
Using the ALA, check the bird data in your area. (See User Guide 1 – Finding the species recorded in your area.)
Table 1: Sample bird data from an area within a 1 km radius of Theodore, ACT.
• Write a few sentences to outline the similarities and differences between the bird data you gathered and the data from the same area from the ALA. What are some possible reasons for the differences?
Links to the Australian Curriculum
Depending on the Year Level and the parts of the activity you choose, the following content from the Australian Curriculum – Mathematics could be covered by Activity 1.
Year 1
Represent data with objects and drawings where one object or drawing represents one data value. Describe the displays (ACMSP263)
Year 2
Collect, check and classify data (ACMSP049)
Create displays of data using lists, table and picture graphs and interpret them (ACMSP050)
Year 3
Collect data, organise into categories and create displays using lists, tables, picture graphs and simple column graphs, with and without the use of digital technologies (ACMSP069)
Interpret and compare data displays (ACMSP070)
Year 4
Construct suitable data displays, with and without the use of digital technologies, from given or collected data. Include tables, column graphs and picture graphs where one picture can represent many data values (ACMSP096)
Evaluate the effectiveness of different displays in illustrating data features including variability (ACMSP097)
Year 5
Construct displays, including column graphs, dot plots and tables, appropriate for data type, with and without the use of digital technologies (ACMSP119)
Describe and interpret different data sets in context (ACMSP120)
Year 6
Interpret and compare a range of data displays, including side-by-side column graphs for two categorical variables (ACMSP147)
Year 7
Construct and compare a range of data displays including stem-and-leaf plots and dot plots (ACMSP170)